
 English
 简体中文
 日本語
 Malay
 Tiếng Việt
 ภาษาไทย
Descending Triangle
A Descending Triangle is formed by lower swing highs, and swing lows that reach similar price levels. When the price moves at the end of the this pattern, it will breakout and fall down with high probability.
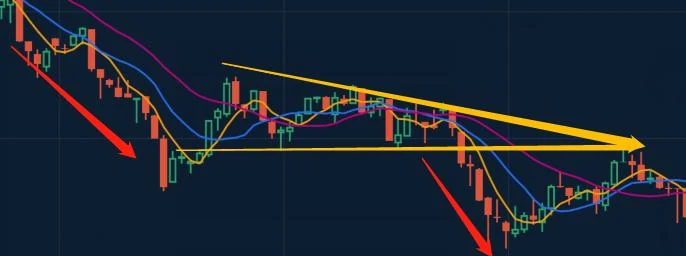
How to trade in a Descending Triangle?
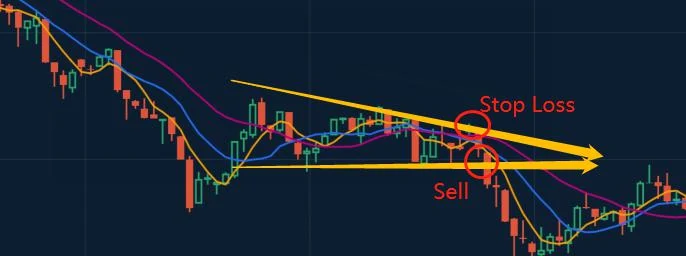
Draw a trendline along the similar swing lows and a trendline of the falling swing highs of the Descending Triangle. We can Buy when the price breakouts down the trendline, and place a loss stop at the recent swing high.
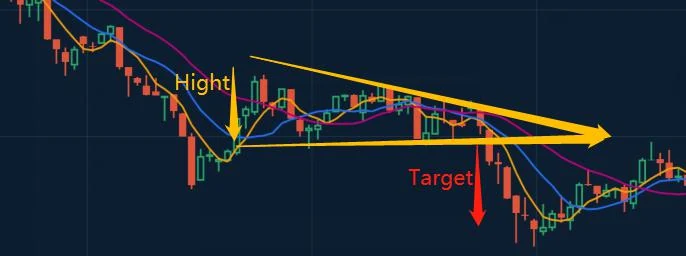
The profit target is the height of the Descending Triangle Pattern. We can subtract the first falling low price from the first swing high price. This gives us the height of the pattern, also the profit space.
Knowing how to recognize and trade triangles is a good skill to have. They are common, and useful in transaction.